
Best Practice Metrics for Tower-based I&O Services
When going to market to secure proposals for Infrastructure and Outsourcing (I&O) services, the responses you receive can be overwhelmingly complex and can challenge your ability to do a true apples-to-apples comparison. This 5-part series takes you through the steps you should take to ensure your responses are not only normalized but aligned in a manner so you can operationalize your agreement(s), once finalized.
This series is broken out to address the 5 primary towers of I&O:
- Help Desk (sometimes referred to as Common Services)
- Hosting
- Network
- Application Management
- Security
Each tower of service is unique and comes with its own set of challenges in how your providers will look to respond to your RFP. If your RFP allows for too much latitude, rest assured you will get widely varying pricing proposals and cost metrics. In this series, we evaluate each tower and share some typical examples of how your prospective providers will attempt to position their services and their approaches to pricing. Based on client engagement experience, recommendations will be provided on what metrics align most directly with use, value, and traceability.
Part 1: Help Desk Outsourcing
When soliciting proposals to support your help desk outsourcing needs, preparation is critical to ensure you obtain responses that align with your organizational needs today, tomorrow and throughout the term of your award. Assess your current support model and obtain both objective and subjective data of your current state to determine your help desk requirements to share with all potential providers. Estimate your demand throughout the term to also ensure you present the most accurate picture of opportunity from which your providers can respond.
Key factors that influence a provider’s response include:
- A detailed view of in-scope services (i.e., Level 0, 1, 2 and 3)
- Historical ticket counts by class
- Clear articulation of language requirements
- Geographic distribution of users
Providing this level of visibility as early in the evaluation process as possible will favorably influence your provider responses and provide the most accurate estimates of support costs. In addition to quantifying these metrics, comparing your baseline of current levels of services being provided today can be leveraged to assess the strength of each provider’s responses.
Typical examples of prospective provider’s help desk outsourcing responses when response expectations are left open-ended or when requirements of services in and out of scope remain unclear include:
|
|
|
|---|
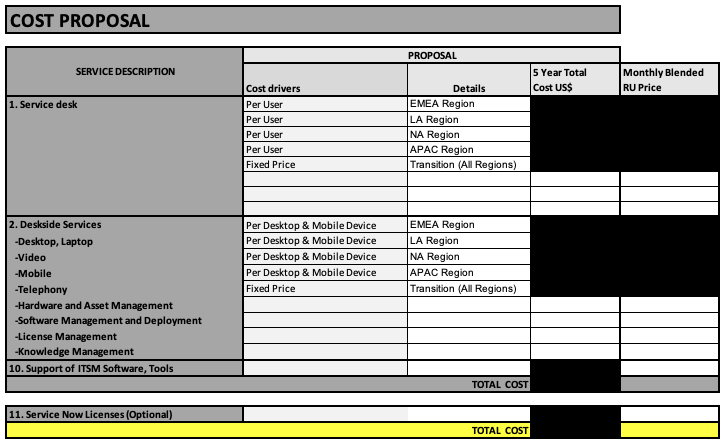
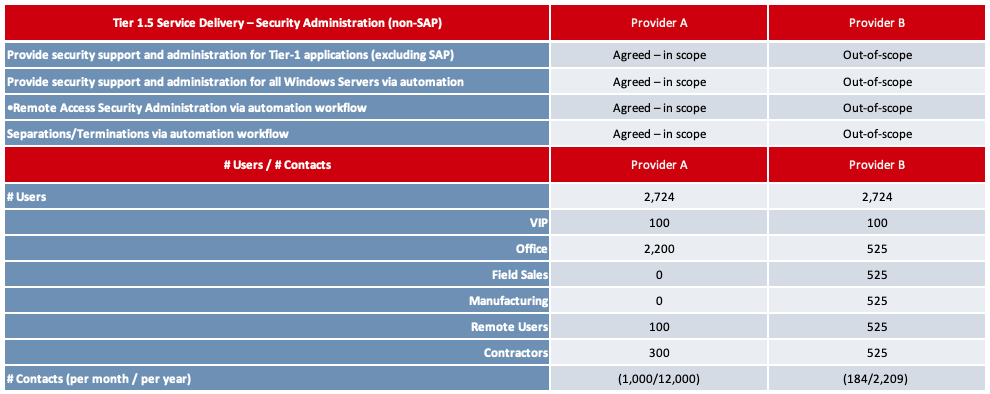
As you will notice from these examples, unclear requirements or open-ended asks for pricing will produce proposal responses that don’t align with your expectations. They also cater to provider-favorable metrics that ensure higher margins and base cost commitments that don’t directly align to actual services being delivered. Common pricing approaches that favor providers include:
- Device-based Metrics: Often your help desk providers will want to tie cost to the physical devices within your organizations (e.g., # desktops or # laptops). These metrics can be easily counted but stray from tying directly to the number of services required when the sheer quantity of these devices does not tie to the effort expended. Tying “active users” to these devices is a more accurate alignment of service needs than a count of physical devices.
- Bundled Pricing: Bundled pricing is a common provider practice to simplify the financial structure and reduce administrative overhead in the management of services. The biggest drawback of bundled pricing is the lack of transparency to actual consumption of discrete services and should always be challenged and broken out.
- Fixed Fees: As you can see from the examples above, we often see providers looking to protect a fixed base of revenue each month committed to a specific percentage of fees. While an argument can be made for a discrete amount of fixed fee costs related to help desk services, this fee should be challenged, and variable costs should be taken out wherever possible. Examples of legitimate fees you can expect to be included in fixed fees would be subscription licenses for tools, communication charges, reporting efforts, etc.
Cost Metrics to Operationalize
Key metrics that operationally align to organizations and support the ability to track and manage the consumption of services include:
- Infrastructure Ticket counts — price per ticket/request per month for all months of a term
- Infrastructure Incidents counts — price per incident per month for all months of a term
These are the base metrics that most tightly align to the areas your provider will expend effort. Ask for these price points per month for all months of the term based on the forecasted demand you provide as part of your RFP. Alternately, you can provide average demand per month for each year of the term and request their pricing reflects your average demand for each year of the term. In addition to requesting these price points, request each supplier provides you with a detailed resource breakdown by role, effort, role location, and rate. This will provide you, or an engaged third-party advisor, the ability to do an FTE efficiency analysis to ensure the staffing levels support the efficient utilization of resources tied to your projected ticket volumes.
Leveraging prescriptive metrics tied to the effort expended against current and future demand will ensure you will be able to do a true apples-to-apples comparison of provider responses and also ensure you can operationalize the management of your chosen provider.
Key points of value you will obtain with a structured, prescriptive metric-based template request include:
- Transparency of productivity improvements (both in scale and efficiency over time) as you will see the year over year effects of price changes
- True apples-to-apples comparisons of costs by unit metric across proposals
- Key price differentiation by metrics that can spark discussion of the assumption of services tied to a given metric-based price point (e.g., one provider assumes Level 0 and Level 1 support where another assumes only Level 1 support)
- Productivity improvement variations across proposals that can be used to understand the variance of assumptions across provider responses