
Best Practice Metrics for Tower-based I&O Services
As we continue our 5-part series, we turn our attention to hosting metrics. If you missed Part 1 on help desk outsourcing, you can find it by clicking here.
Each tower of service is unique and comes with its own set of challenges in how your providers will look to respond to your RFP. If your RFP allows for too much latitude, rest assured you will get widely varying pricing proposals and cost metrics. We evaluate each tower and share some typical examples of how your prospective providers will attempt to position their services and their approaches to pricing. Based on client engagement experience, recommendations are provided on the metrics that align most directly with use, value and traceability.
As a reminder, the 5 primary towers of I&O are:
- Help Desk (sometimes referred to as Common Services)
- Hosting
- Network
- Application Management
- Security
Part 2: Hosting
When soliciting proposals to support your hosting services outsourcing needs, preparation is critical to ensure you obtain responses that align with your organizational needs today, tomorrow and throughout the term of your award. Assess your current support model and obtain both objective and subjective data of your current state to determine your hosting service requirements to share with all potential providers. Estimate your demand throughout the term to also ensure you present the most accurate picture of opportunity from which your providers can respond.
Key factors that influence a provider’s response to I&O hosting services include:
- Compute Support:
- OS Type: AIX, Linux, Windows
- Physical or Virtual: Further classification quantification where physical servers are represented by # devices and virtual servers are represented by # of instances
- Production or Non-Production: Indicating the quantity of prod vs. non-prod devices or instances
- Public or Private: Indicating which you prefer. If undecided, ask for two separate proposals
- Server Sizing (CPUs): Often measured by # of CPUs within ranges (typical ranges: 1-4 CPUs represent a small server; 5-8 CPUs represent a medium server; and 9-16 represent a large server)
- Server Sizing (RAM): Along with CPU sizing for servers comes the added dimension of RAM requirements per server. Typical RAM sizing of 128MBs up to 3TBs of RAM will create a multitude of combined server configurations as you pair CPU and RAM requirements into unique metrics
- Disaster Recovery: Typically applies to production, pre-production, QA, occasionally for test, but rarely a service required for development
- High Availability: Typically applies to production
- Pricing Models: Pay-as-you-go (PAYG) or Reserve Instances (RI) by years of commit
- Mainframe Support:
- Operations: Represented either in MIPS, devices or LPARs
- Batch Support: # batches per day or per month
- Databases / Storage:
- Platform: DB2, Oracle, MySQL, SQL
- Sizing: Terabyte (TB), Gigabyte (GB), and in some instances, Petabytes (PB)
- General Requirements:
- Support Hours: Denoting requirements for service support hours is best known up-front, providing a view of your needs, e.g., 24/7/365, 24/5/365. Knowing this by environment will ensure you get accurate pricing and you will have no surprises mid-stream in the process
- Availability: System availability by environment is also critical to ensure clear pricing comes back against your metrics that factors in the system availability of your hosting environment. Typical metrics should include % of uptime and acceptable maintenance windows.
Prescriptively calling out metrics by environment (prod, dev / test, & disaster recovery) and type (Windows, Linux, Database, etc.) allows you to obtain direct pricing estimates that align to distinct support requirements that differ by environment and device. Further classifying by environment, grouping servers by OS, range of CPU (e.g., 1-4), RAM max (e.g., up to 1TB) will ensure corresponding pricing metrics remain at a manageable level. Left to the provider to cost out your support services you are more likely to get a price by physical device that maps to the inventory and specifics of each server in your current inventory.
This approach favors the vendor as they can then manage change (and corresponding increases in revenue with every CPU add and every RAM add to a given device). Quantifying and categorizing your hosting service support needs by providing distinct server classes as early in the evaluation process as possible will favorably influence your provider responses and ensure the pricing obtained at these levels limit the “SKUs” they can provide costs for, while ensuring you can do an apples-to-apples compare across provider responses.
In addition, requesting supporting service level expectations aligned to environment devices will allow you to leverage existing historical metrics as points of comparison to how your providers respond to your SLA requirements. In addition to quantifying these metrics, comparing your baseline of current levels of service being provided today can be leveraged to assess the strength of each provider’s responses. Defining these metrics to align to how you estimate and manage your current infrastructure needs will ensure your organization doesn’t have to address material changes in how you operate and estimate once you award.
Note that providers and even companies can cloud the issue of metrics by providing line item costs for types of services to be performed against server configurations, creating more overhead that is better served when stated as service expectations in RACI form. Typical examples of prospective provider’s hosting services outsourcing responses to open-ended requirements are shown below:
Figure 1 (click to enlarge)
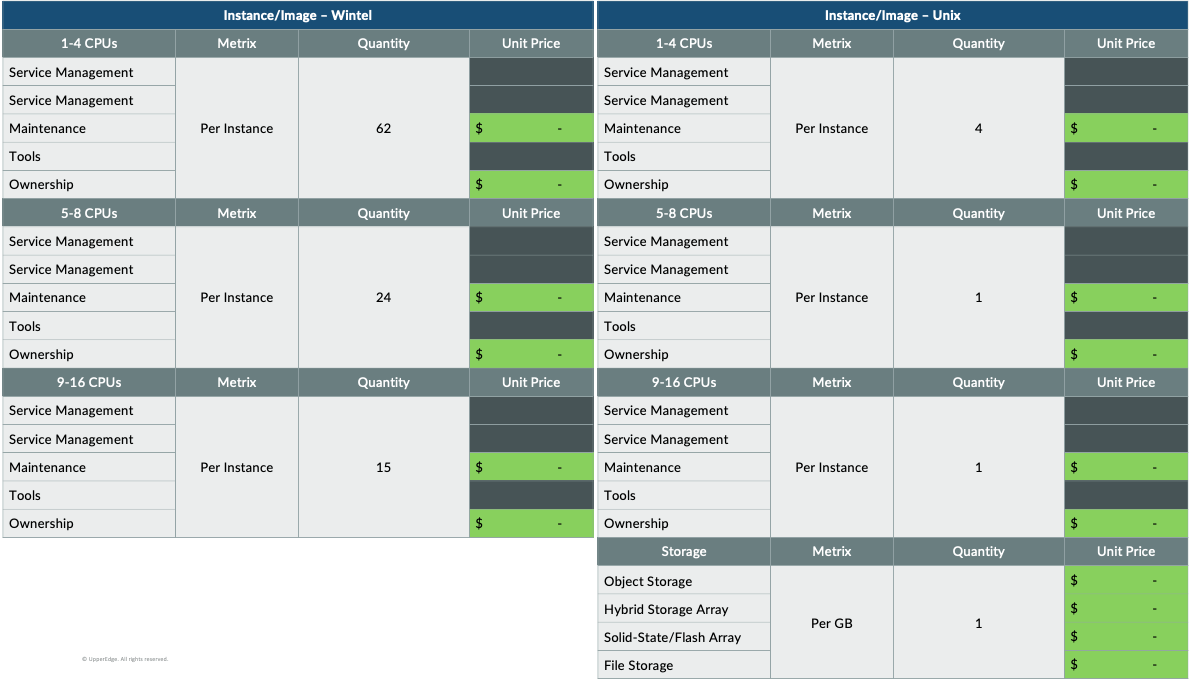
Figure 2 (click to enlarge)
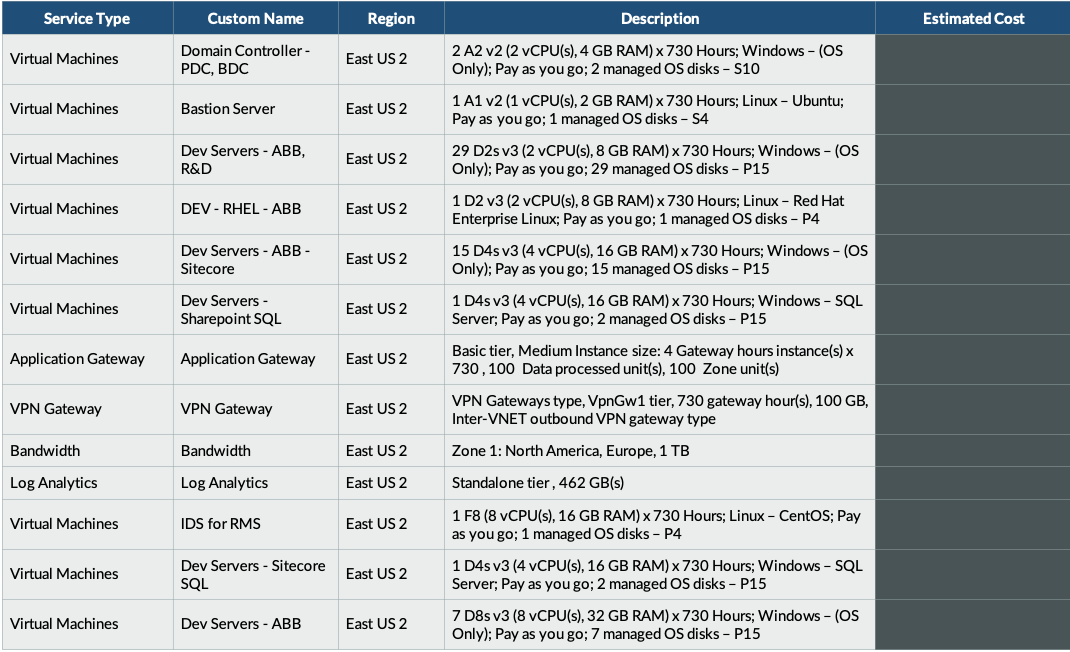
Figure 3 (click to enlarge)
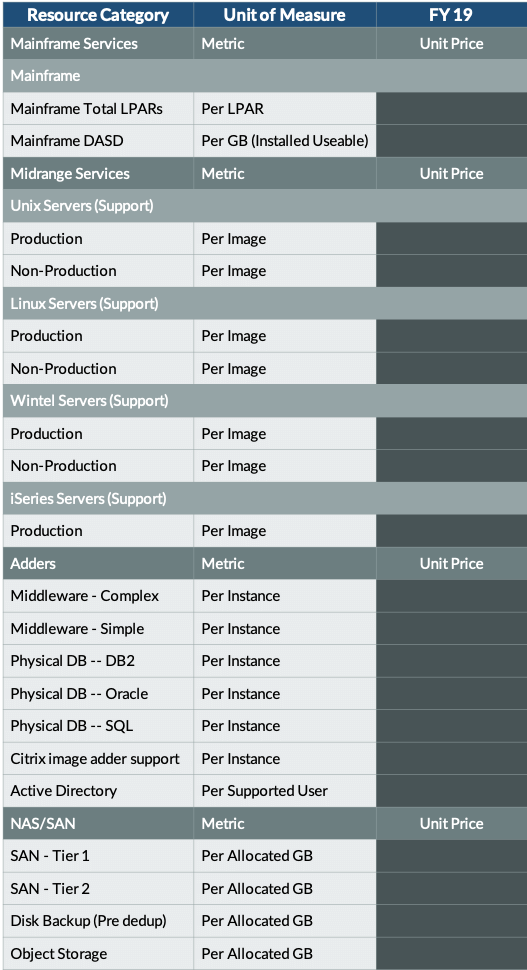
Common pricing approaches that favor providers include:
- Named Actual Device-based Metrics: Often your help desk providers will want to tie cost to the physical devices within your organization (e.g., Prod Windows Server01 with 4 CPUs and 128GB RAM or Prod Windows Server 43 with 4 CPUs and 64GB RAM). These metrics can be easily counted but, taken so literally, create massive overhead, management and review with every billing cycle and discrete configuration change. Tying “server support costs” to server classes is a more operational management approach that will still align with service needs.
- Bundled Pricing: Bundled pricing is a common provider practice to simplify the financial structure and reduce administrative overhead in the management of services. The biggest drawback of bundled pricing is the lack of transparency to actual consumption of discrete services and should always be challenged and broken out.
- Fixed Fees: As you can see from the examples above, we often see providers looking to protect a fixed base of revenue each month committed to a specific percentage of fees. While an argument can be made for a discrete amount of fixed fee costs related to hosting services, this fee should be challenged, and variable costs should be taken out wherever possible. Examples of legitimate fees you can expect to be included in fixed fees would be subscription licenses for monitoring tools, patch management services, reporting efforts, etc.
Cost Metrics to Operationalize
Key metrics that operationally align to organizations and support the ability to track and manage the consumption of services include:
- Server classifications by category (mainframe, midrange, middleware, database, and SAN with units of measure (LPAR, GB, image, supported user, etc.))
- Server provisioning / de-provisioning — Price to stand up / take down environments
- Line item adds – Cost to add 1 CPU, 1 GB of RAM, 1 GB/TB of storage
- Infrastructure incidents counts — Price per incident per month for all months of a term
- User provisioning – Access rights, account set-up per user / request
These are the base metrics that most tightly align to the areas your provider will expend effort. Ask for these price points per month for all months of the term based on the forecasted demand you provide as part of your RFP. Alternately, you can provide average demand per month for each year of the term and request their pricing reflects your average demand for each year of the term. In addition to requesting these price points, request each supplier provides you with a detailed resource breakdown by role, effort, role location, and rate. This will provide you, or an engaged third-party advisor, the ability to do an FTE efficiency analysis to ensure the staffing levels support the efficient utilization of resources tied to your projected ticket volumes.
Leveraging prescriptive metrics tied to effort expended against current and future demand will ensure you will be able to do a true apples-to-apples comparison of provider responses and also ensure you can operationalize the management of your chosen provider.
Key points of value you will obtain with a structured, prescriptive metric-based template request include:
- Transparency of productivity improvements (both in scale and efficiency over time) as you will see the year-over-year effects of price changes
- True apples-to-apples comparisons of costs by unit metric across proposals
- Key price differentiation by metrics that can spark discussion of the assumption of services tied to a given metric-based price point
- Productivity improvement variations across proposals that can be used to understand the variance of assumptions across provider responses.
Post a comment below, find my other UpperEdge blogs and follow UpperEdge on Twitter and LinkedIn.