
Best Practice Metrics for Tower-based I&O Services
As we continue our 5-part series on Normalizing Your I&O RFP Proposals: Solid Metrics You Can Operationalize, we turn our attention to network metrics. As a review, Part 1 covered help desk outsourcing and Part 2 covered hosting metrics.
As we’ve been discussing throughout this series, each tower of I&O service is unique and comes with its own set of challenges in how your providers will look to respond to your RFP. If your RFP allows for too much latitude, rest assured you will get widely varying pricing proposals and cost metrics. We evaluate each tower and share some typical examples of how your prospective providers will attempt to position their services and their approaches to pricing. Based on client engagement experience, recommendations will be provided on the metrics that align most directly with use, value and traceability.
As a reminder, the 5 primary towers of I&O are:
- Help Desk (sometimes referred to as Common Services)
- Hosting
- Network
- Application Management
- Security
Part 3: Network
As with all towers of I&O services, prior to soliciting proposals to support your network services outsourcing needs, preparation is critical to ensure you obtain responses that align with your organizational needs today, tomorrow and throughout the term of your award. Assess your current network footprint and support model to obtain both objective and subjective data of your current state to determine your network service requirements to share with all potential providers. Estimate your demand throughout the term to also ensure you present the most accurate picture of opportunity from which your providers can respond.
Key factors that influence a provider’s response to I&O network services include:
- Voice:
- Handsets: # of ports, # of users
- Voicemail: # of voicemail boxes
- Video Devices: # of desktop video (e.g., softphones, Jabber), # of video rooms (single codec, multi-codec)
- Data:
- Switches: Represented as a single aggregate # of switches or quantity by size / category (i.e., very small, small, medium, large and very large), noting that the greater the level of granularity you can share will allow providers to understand how complex, and therefore how costly, it will be to support.
- Routers: The same goes for routers which can be represented as an aggregate total of routers or quantity by size / category (i.e., very small, small, medium, large and very large), again noting that the more detail you can share, the better the provider can estimate the effort to support.
- POS Devices: # of point of sale devices that must be managed / monitored
- Firewalls: # of firewalls and related devices
- Load Balancers: # of load balancers
- WAP: # of wireless access points by type / device
- General Requirements:
- Monitoring: Voice and data network monitoring requirements, alerts and notifications required to ensure sustained health of your network services.
- Latency: Packet latency, packet loss
- Break Fix: # of spares, time to fix / replace
- Availability: Voice and data network availability commitments are critical to obtain in all provider responses typically expressed as a percentage of uptime (less scheduled maintenance windows).
Prescriptively calling out metrics by size of device affords you control to determine how you want to ultimately manage your voice and data support. Depending on where you see the largest device growth and any upgrades / improvements or refresh cycles you have in your plans will ultimately inform your decisions on what metrics serve your needs and what level of operational oversight you can support. Requesting support pricing by size of device provides you the ability to make an informed decision.
Quantifying and categorizing your network support needs by providing discrete baseline quantities by size as early in the evaluation process as possible will require your provider to respond with support costs in line with the size and complexity of your network topology and ensure the pricing obtained at these levels will allow for an apples-to-apples compare across provider responses.
In addition, requesting supporting service level expectations aligned with your own historical metrics as points of comparison will increase the credibility of your SLA requirements. Comparing your baseline of current levels of services being provided today with the responses you receive from providers will aid you in assessing the strength of each provider’s responses. Ensuring your metrics align to how you estimate and manage your current networking needs will ensure your organization won’t have to address material changes in how you operate and estimate once you award.
Below are examples of the wide range of provider response metrics you can expect to receive from your network services RFP and how they vary based on the extent of asks / metrics left open-ended:
Figure 1 (click to enlarge)

Figure 2 (click to enlarge)
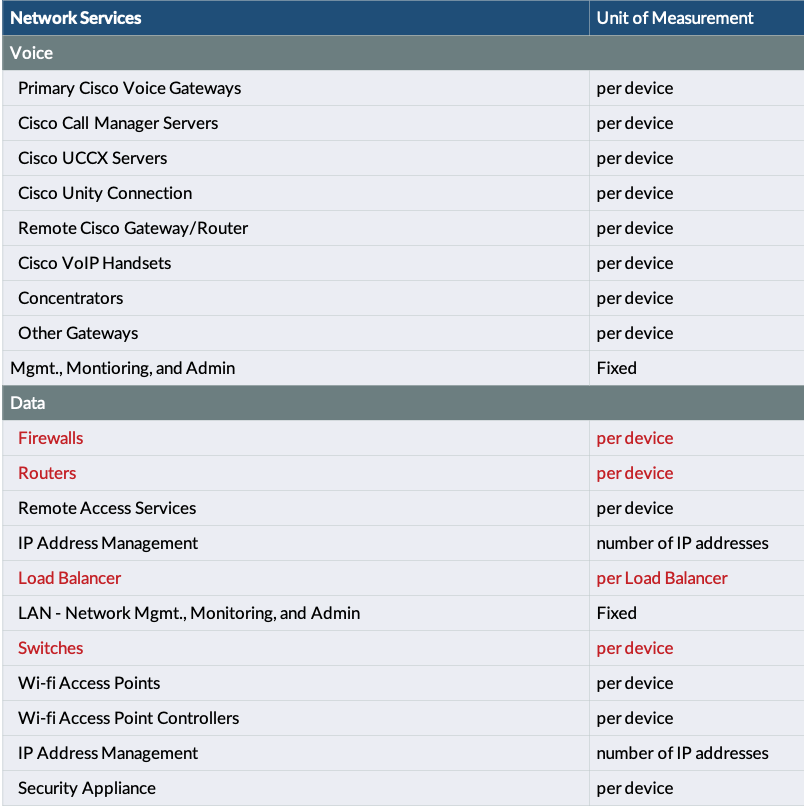
Figure 3 (click to enlarge)

This last illustrative example in Figure 3 is most closely aligned with the manner you would like your providers to respond. This metrics-based view addresses core components of voice and data network service needs as discrete while remaining OEM / model agnostic affording you a more direct alignment to costs tied to complexity of device with flexibility to change / upgrade product lines / models in the future. In addition, with the inclusion of a fixed cost component for monitoring, you allow the provider some certainty to costs related to managing / monitoring their network services.
Common pricing approaches that favor providers include:
- Named Actual Device-based Metrics: Often your network providers will want to inundate you with specific pricing by make, model and serial number to provide the fullest discrete pricing per SKU, to ensure cost tie to the lowest levels of uniqueness of physical devices. This is a common tactic that allows providers to demonstrate how they can detail costs at a line item level. This approach, however, creates an unlocked and open back door to reset pricing the moment a new product / version is introduced to the environment. When this happens, you have no price protections and are exposed to increases in costs that most likely were not planned, may need to be benchmarked, and in most cases won’t align with the support costs of the new device.
In addition, this pricing approach also creates a level of overhead each month to verify invoices at these levels. These metrics can create extensive overhead, management and review with every billing cycle and discrete configuration change. Tying “network support costs” to device classes is a more operational management approach that will still align with your network hosting and support needs.
- Bundled Pricing: Bundled pricing is a common provider practice to simplify the financial structure and reduce administrative overhead in the management of services. The biggest drawback of bundled pricing is the lack of transparency to actual consumption of discrete services and should always be challenged and broken out.
- Fixed Fees: As you can see from the examples above, we often see providers looking to protect a fixed base of revenue each month committed to a specific percentage of fees. While an argument can be made for a discrete amount of fixed fee costs related to network services, this fee should be challenged, and variable costs should be taken out of fixed fees wherever possible. Examples of legitimate fees you can expect to be included in fixed fees would be subscription licenses for monitoring tools, patch management services, reporting efforts, etc.
Cost Metrics to Operationalize
Key metrics that operationally align to organizations and support the ability to track and manage the consumption of services include:
- Router and switch classifications by category (small, medium, large)
- Availability by environment
- Network device provisioning / de-provisioning — Price to stand up / take down devices
- Line item adds – Cost to add a switch, router, WAP, or video device
- Network incident counts — Price per incident per month for all months of a term
- User provisioning – Access rights, account set-up per user / request
These are the base metrics that most tightly align to the areas your provider will expend effort. Ask for these price points per month for all months of the term based on the forecasted demand you provide as part of your RFP. Alternately, you can provide average demand per month for each year of the term and request their pricing reflects your average demand for each year of the term.
In addition to requesting these price points, request each supplier provide you with a detailed resource breakdown by role, effort, role location, and rate. This will provide you, or an engaged third-party advisor, the ability to do an FTE efficiency analysis to ensure the staffing levels support the efficient utilization of resources tied to your projected ticket volumes.
Leveraging prescriptive metrics tied to effort expended against current and future demand will ensure you will be able to do a true apples-to-apples comparison of provider responses and it will also ensure you can operationalize the management of your chosen provider.
Key points of value you will obtain with a structured, prescriptive metric-based template request include:
- Transparency of productivity improvements (both in scale and efficiency over time) as you will see the year-over-year effects of price changes
- True apples-to-apples comparisons of costs by unit metric across proposals
- Key price differentiation by metrics that can spark discussion of the assumption of services tied to a given metric-based price point
- Productivity improvement variations across proposals that can be used to understand the variance of assumptions across provider responses.
Post a comment below, find my other UpperEdge blogs and follow UpperEdge on Twitter and LinkedIn.